
The Expense/Spend Analysis dashboard provides insights into expense-related metrics and spending patterns within the organization.
Purpose:
-
Monitor and analyze spending trends.
-
Identify potential cost-saving opportunities.
-
Detect outliers and anomalies in spending patterns.
-
Track expenses across different departments and locations.
-
Gain a deeper understanding of your organization's spending behavior.
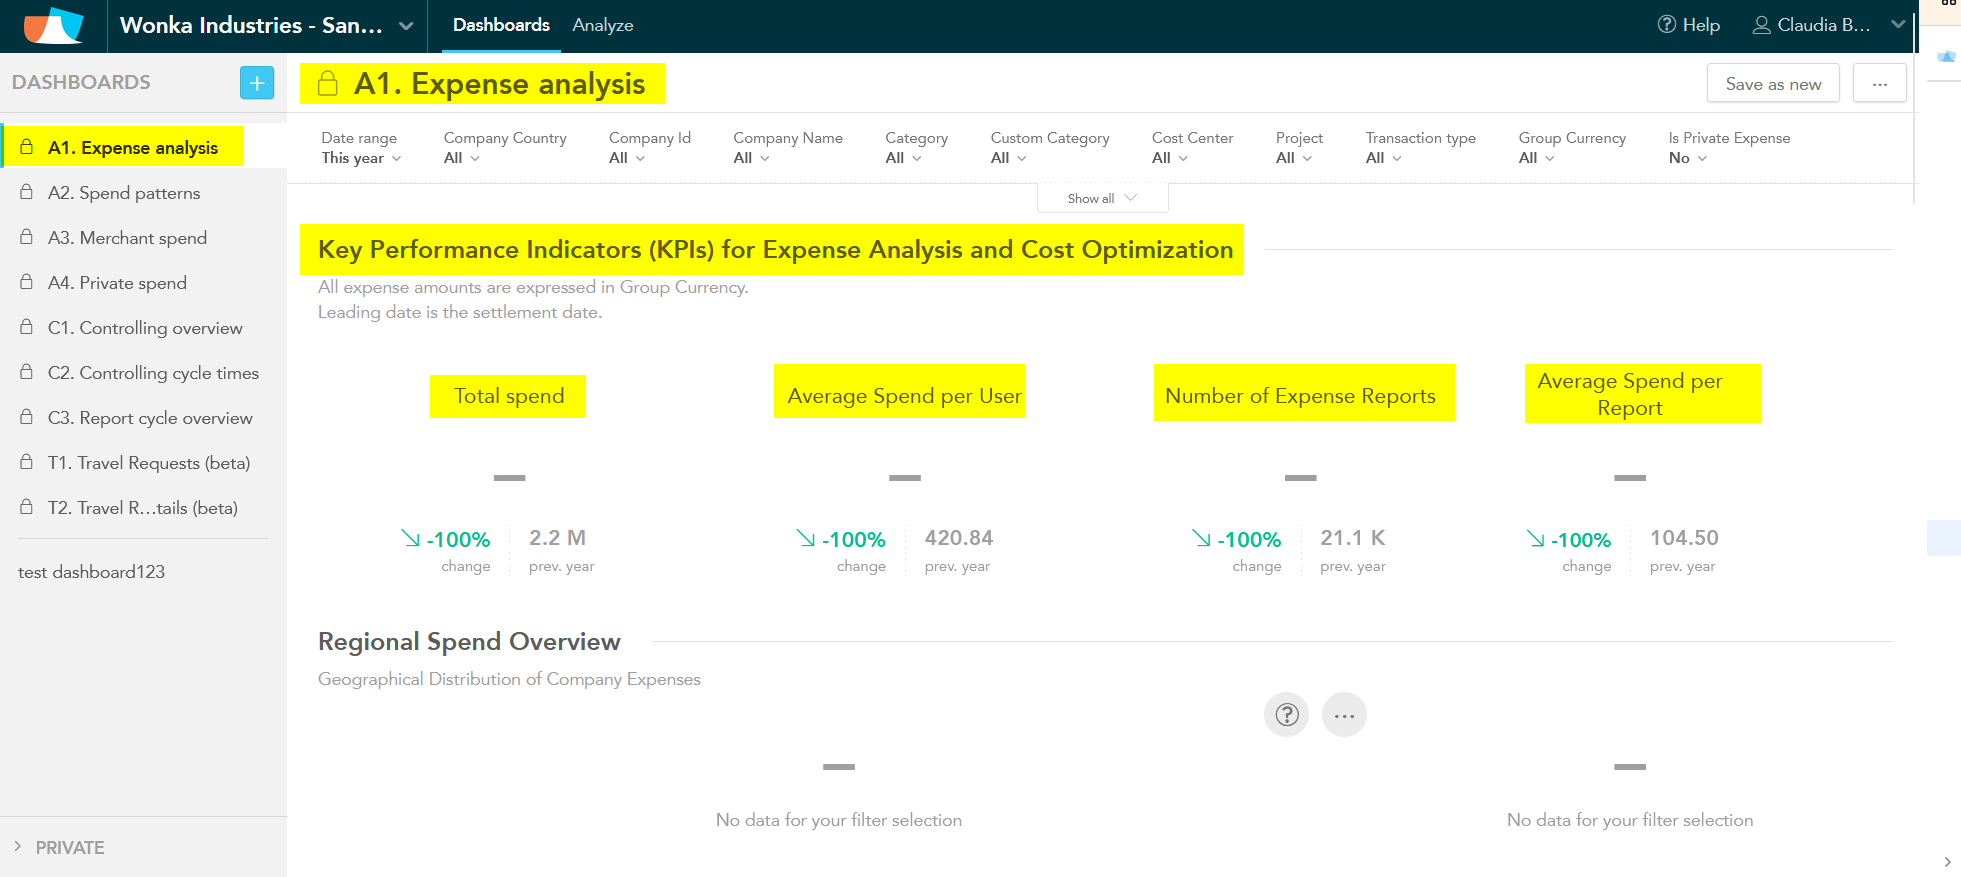
Key Performance Indicators (KPIs):
-
Total Spend: The overall amount spent within a given time frame.
-
Average Spend per User: The average spending amount for each employee.
-
Number of Expense Reports: The total number of expense reports submitted.
-
Average Spend per Report: The average amount spent per expense report.
Key Sections:
-
Regional Spend Overview: Visualizes spending across different regions, highlighting key locations.
-
Spend By Continent: Analyzes spending patterns by continent.
-
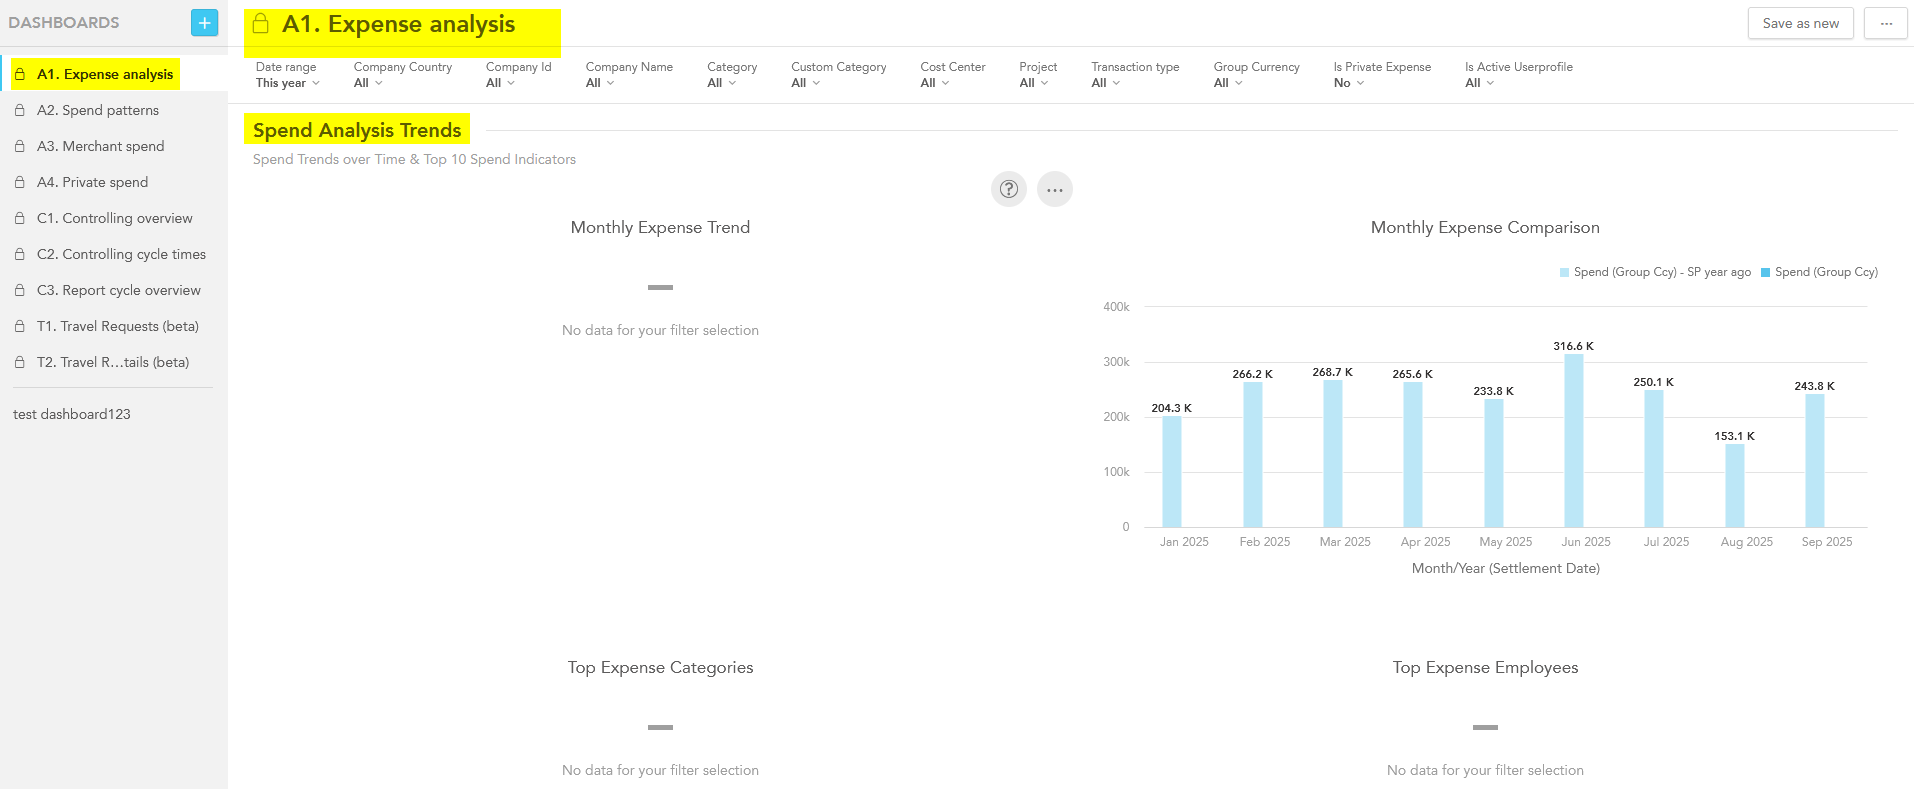
Spend Analysis Trends: Tracks monthly spending trends, compares expenses, and identifies top spending categories, employees, and locations.
-
Drill-down: Allows users to explore data in more detail, such as individual expense reports and spending by specific locations, countries, and merchants.
All expense amounts are expressed in Group Currency and the leading date is the settlement date.