
A2. Spend patterns
This dashboard provides key insights into your organization's spending patterns, enabling data-driven decisions and improved expense management.
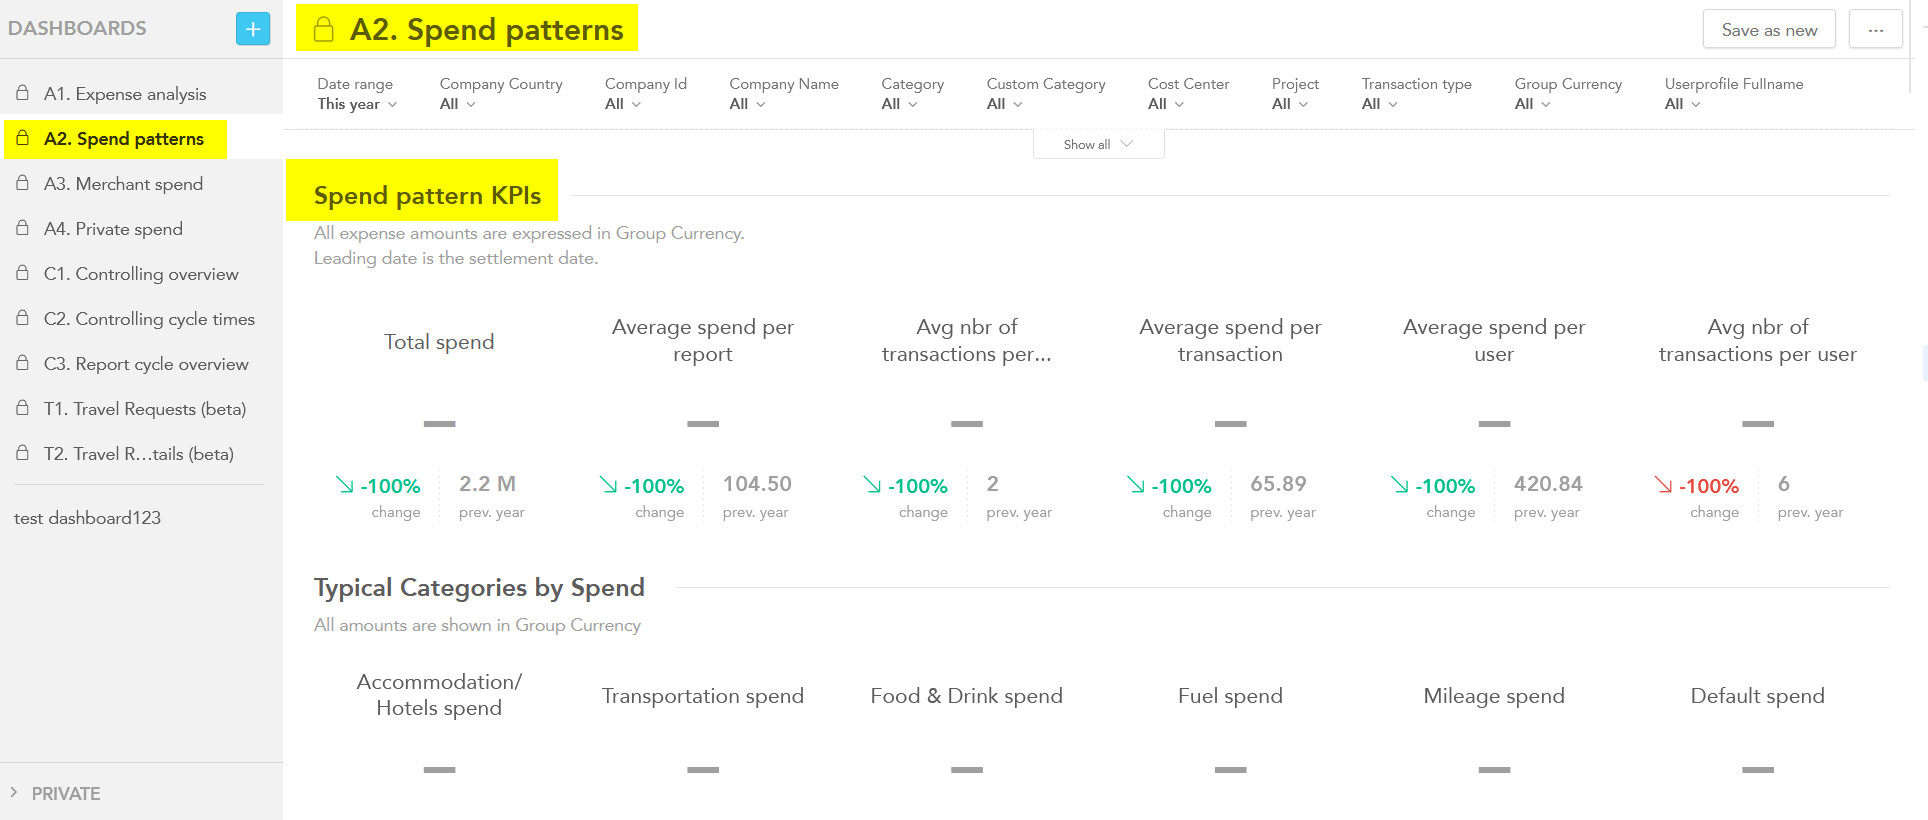
Key Performance Indicators (KPIs):
Number of Expense Reports: Tracks the volume of expense reports submitted.
Average Spend per Report: Measures the average spending amount per expense report.
Average Number of Transactions per Report: Indicates the average number of transactions within each report.
Average Spend per Transaction: Measures the average cost of each individual transaction.
Average Spend per User: Calculates the average spending amount for each employee.
Average Number of Settled Transactions per User: Tracks the average number of transactions processed for each employee.
Sections:
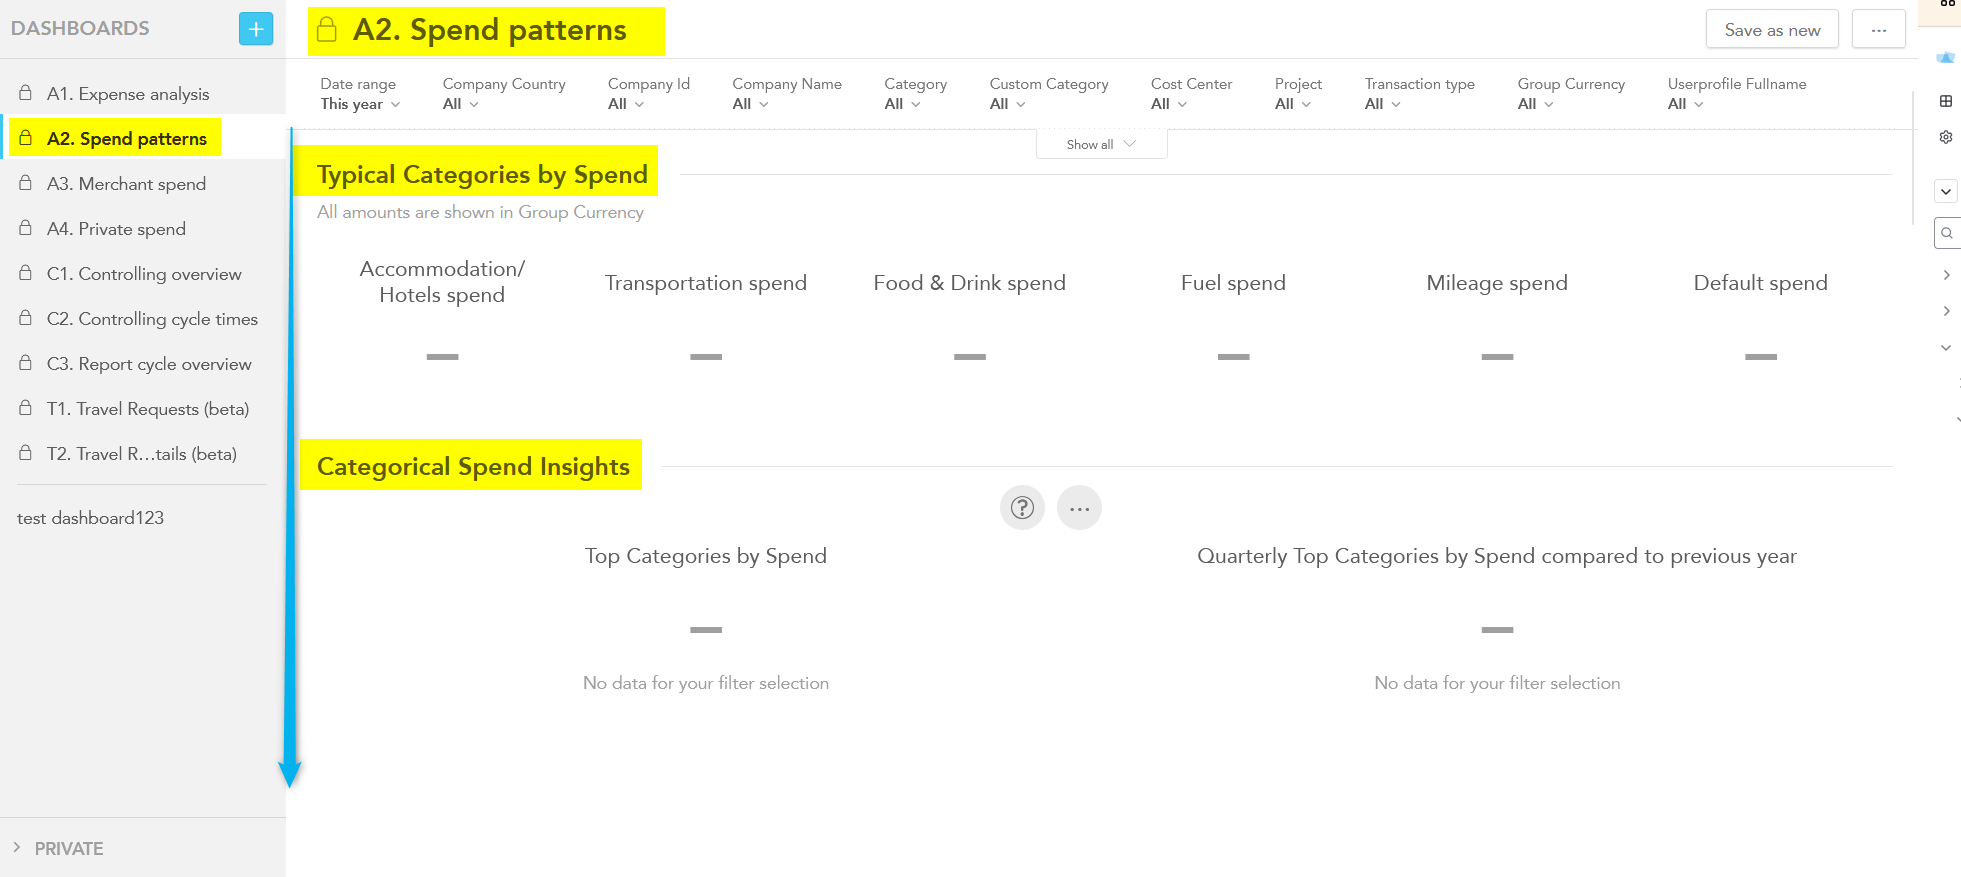
Typical Categories by Spend: Analyzes spending across key categories (Accommodation, Transportation, etc.).
Categorical Spend Insights: Explores spending patterns and distributions across expense categories.
Spend Analysis by Location: Analyzes spending patterns based on geographical location.
Spend Range Analysis: Examines spending distribution across different spend ranges.
All expense amounts are expressed in Group Currency, and the leading date is the settlement date.