The Controlling Cycle Times dashboard tracks the average time expense reports take through submission, approval, and control stages. It identifies bottlenecks, optimizes workflows, and improves expense management efficiency.
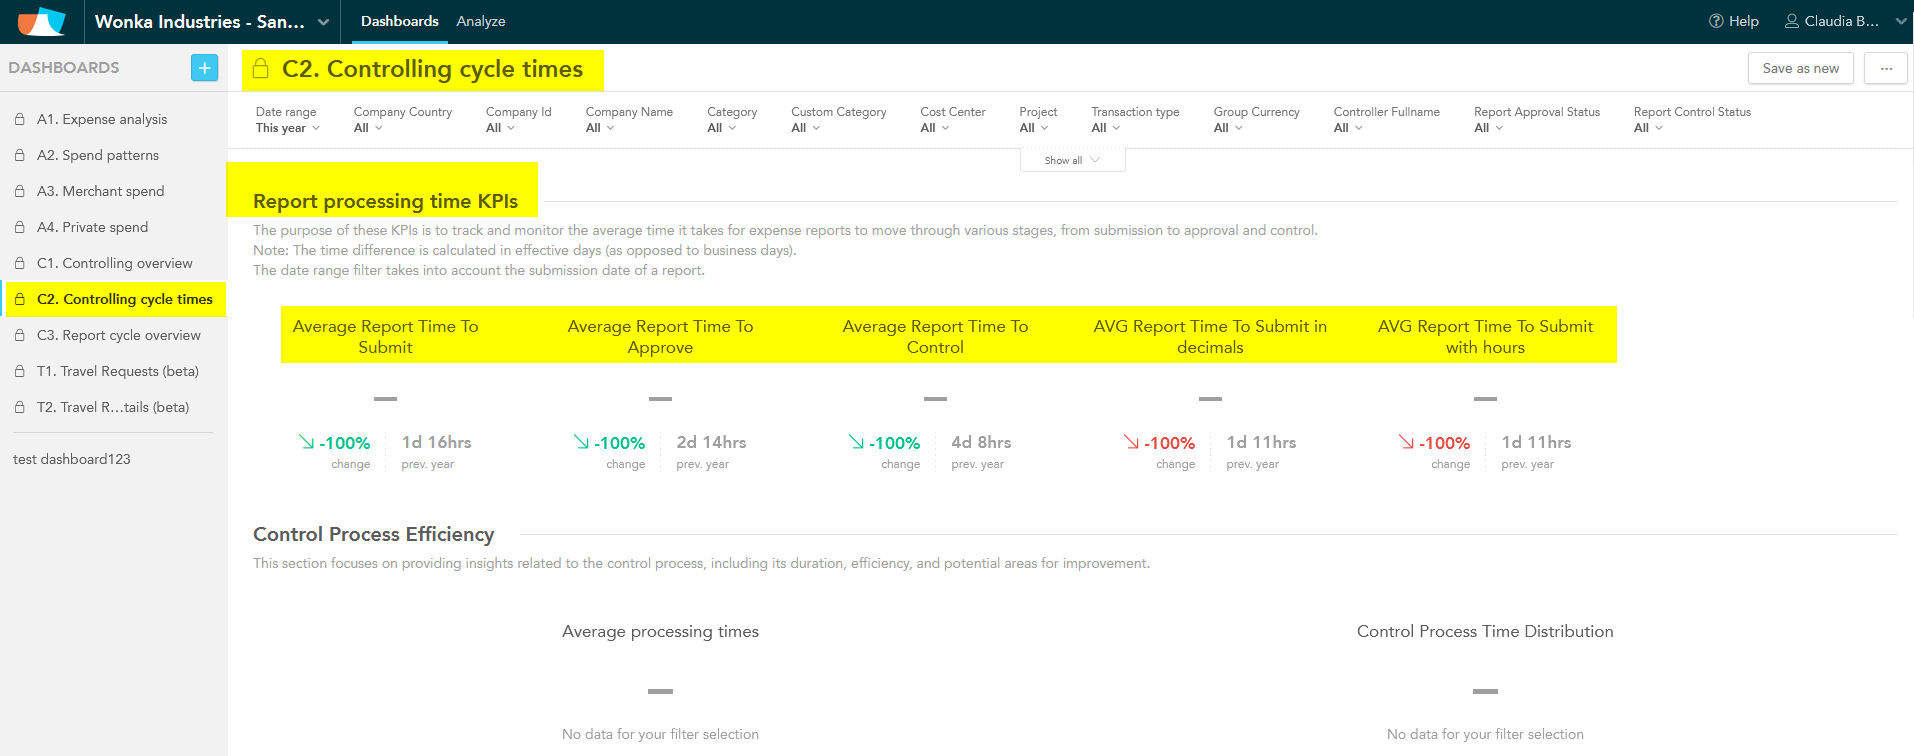
The time difference is calculated in effective days (as opposed to business days). The date range filter takes into account the submission date of a report.
Key Performance Indicators (KPIs):
These KPIs monitor the average time expense reports take to progress through submission, approval, and control stages, ensuring efficiency and identifying delays:
-
Average Report Time to Submit: Tracks how long employees take to submit expense reports after incurring expenses, evaluating promptness and compliance with timelines.
-
Average Report Time to Approve: Measures the time managers or approvers take to review and approve reports, highlighting workflow efficiency and bottlenecks.
-
Average Report Time to Control: Tracks the time finance teams take to complete checks on approved reports, identifying delays in the control process.
Sections:
-
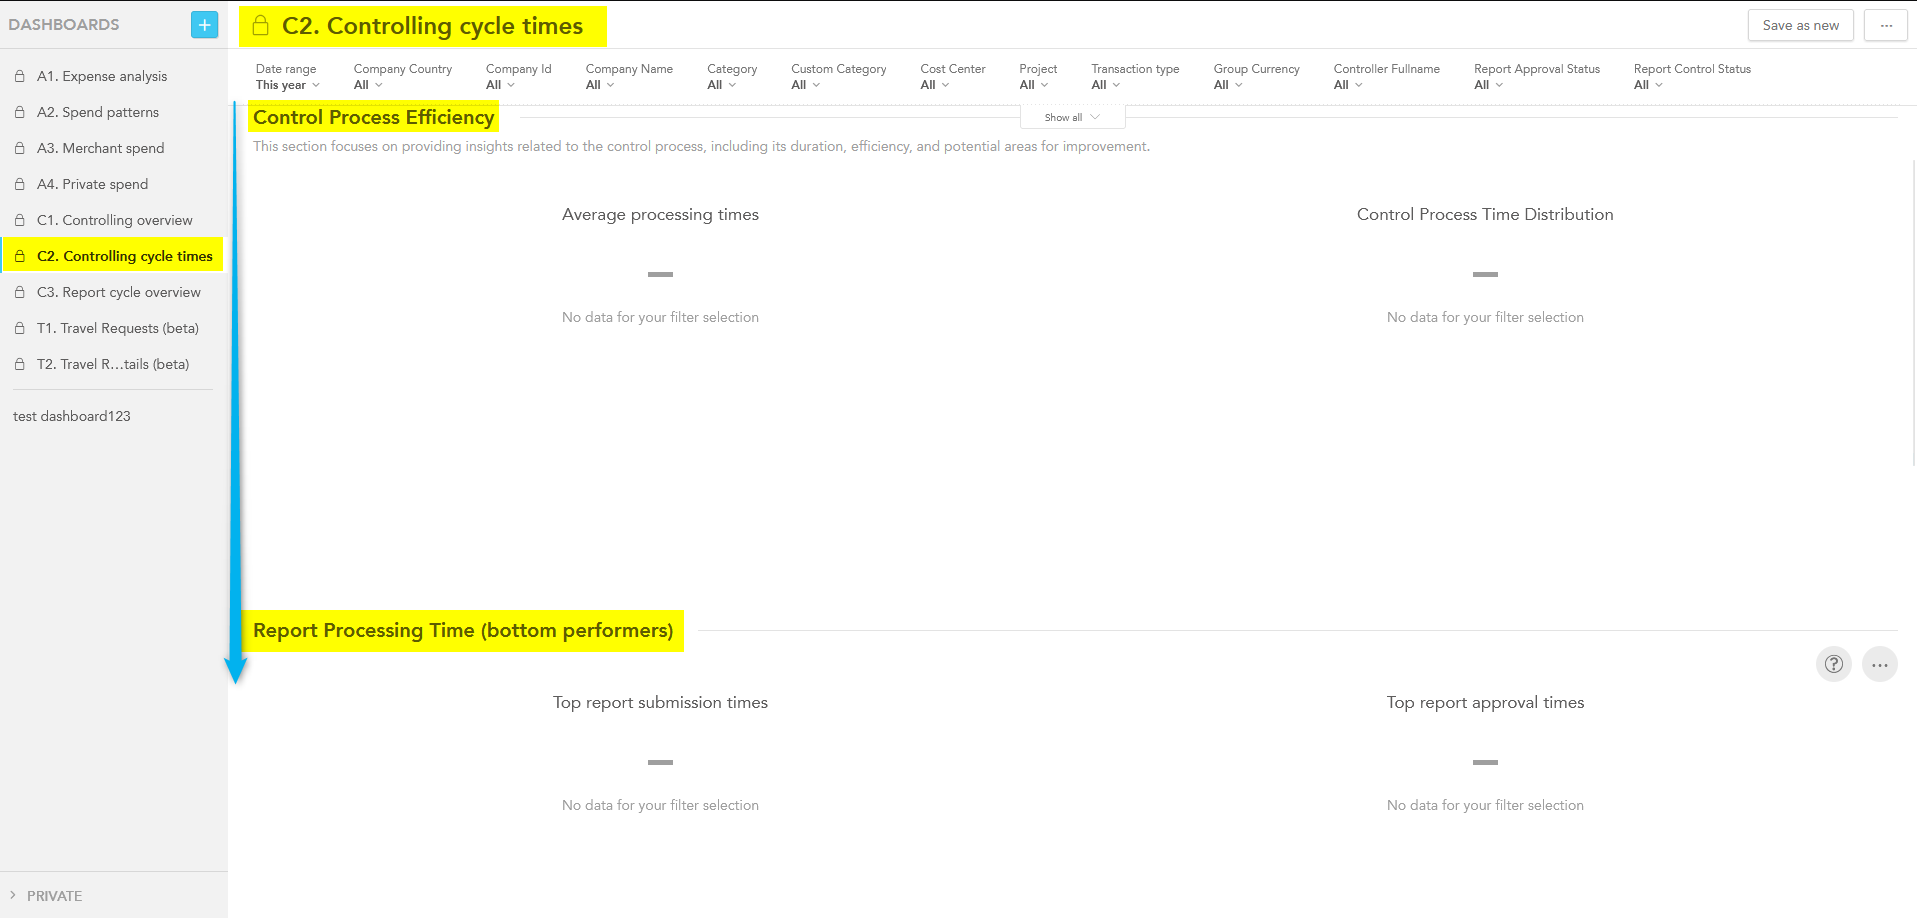
Control Process Efficiency: Visualizes average processing times and distribution, identifying areas for improvement in the control process.
-
Report Processing Time (Bottom Performers): Highlights reports with the longest submission, approval, or control times for analysis and improvement.
-
Controlling Time Detail: Provides a detailed view of control times per report, offering insight into factors affecting the overall process.