
How to use drilling down
Users can utilize the drill down feature to explore data hierarchies and seamlessly navigate through various levels of detail within reports and dashboards. 📊
There are two main types of drilling actions: drilling down and drilling into. Both enable users to examine their data more closely, but they differ in purpose and functionality.
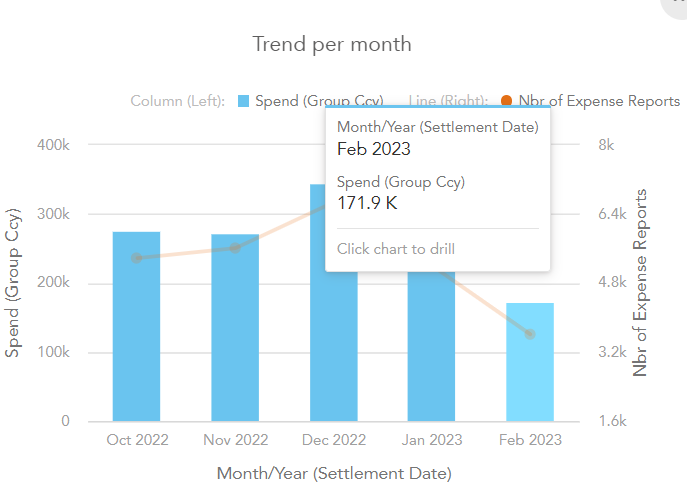
Example the Trend per Month chart allows drilling.
When only one drilling method is available, a single click will instantly navigate you to the drilled chart, giving you immediate access to the desired level of detail.
In contrast, when multiple drilling options are available, clicking will display a menu of drill paths. This menu allows you to select the specific dimension or path you want to explore, ensuring you can choose the most relevant option for your analysis.
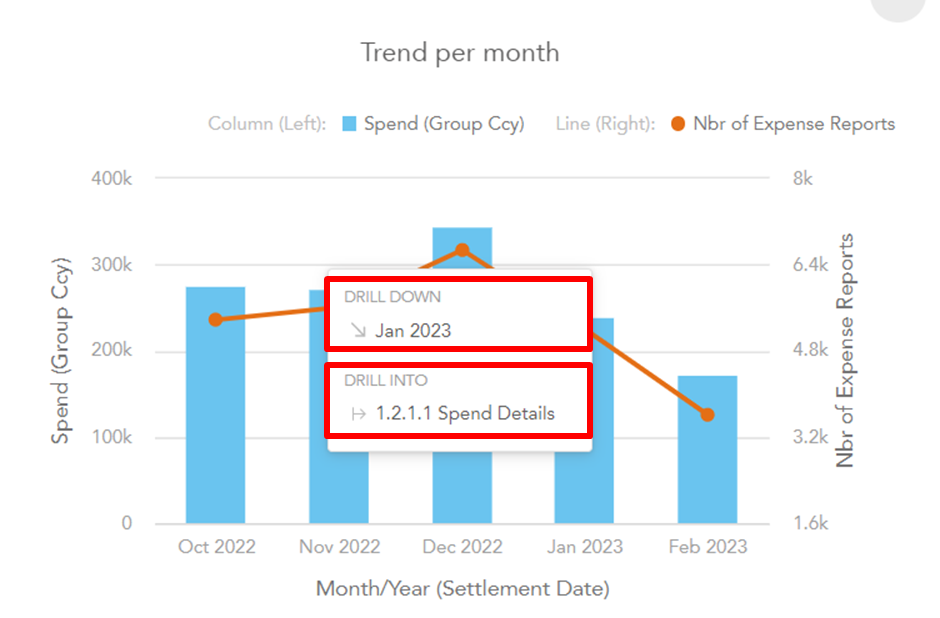
Drilling options: Drill down or Drill into
Drilling Down
Drilling down involves navigating from a high-level summary to more detailed data within a specific dimension or attribute. It enables users to explore data hierarchies and access increasingly granular information. Drilling down follows a predefined hierarchy, such as a drill down path or a date dimension.
* Drill down via a drill down path
The expense model drill down path is as follows:
Company Country → Company Name → Cost Center Reference → Report Reference → Category Name → Merchant Name
For example, starting from a company-wide expense overview, users can drill down to specific cost centers, then into detailed reports within those centers. Each step narrows the focus and reveals more detailed data.
* Drilling down a date dimension
The date dimension follows this hierarchy: Year → Quarter → Month → Day
For instance, users can start with an annual expense overview, drill down to a specific month, and then view daily details for more precise analysis.
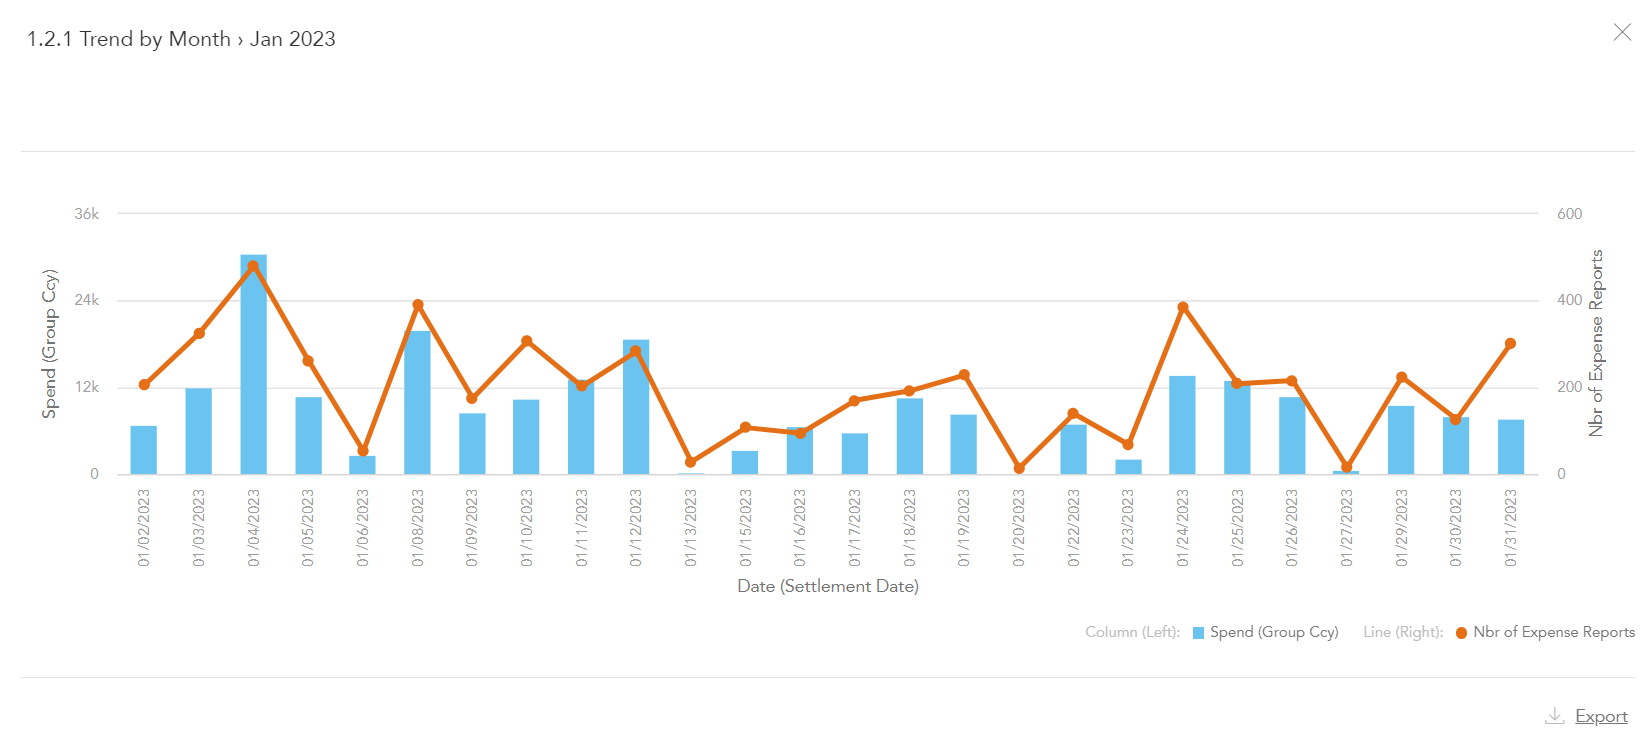
Example: drilling down will present you with a daily time frame of the month Jan 2023,