
How to navigate the interface
This section provides a guide to navigating the Insights interface, covering dashboards, analysis, data exploration, and management features.
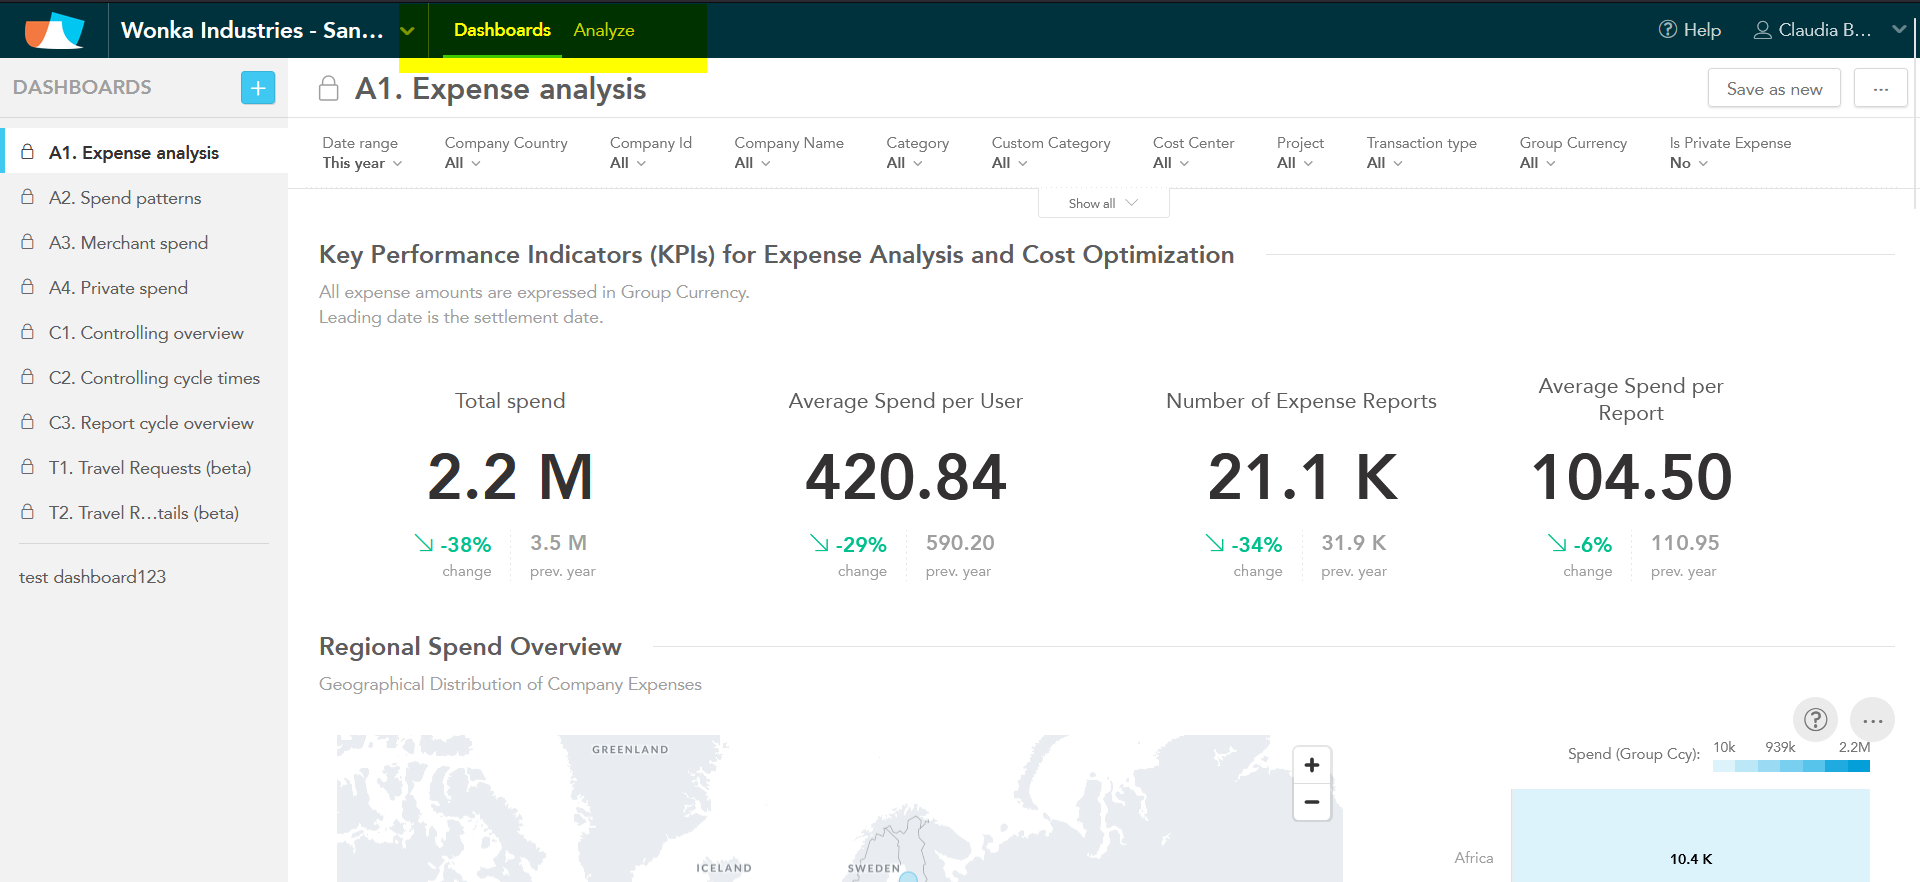
Dashboards
Access pre-built dashboards with visualizations to track spend and process performance. You can also create new dashboards, drill down into specific data points, schedule automated reports, and export dashboard content (PDF, Excel, CSV).
Analyze (Self-Service)
Use the Analyze tab for self-service analysis. Explore and customize existing insights or create new ones using available metrics, attributes, and facts. Export insights in Excel or CSV formats for sharing with stakeholders or adding to reports.