A dashboard is a visual representation of key metrics, data, and performance indicators, typically presented in real-time or periodically, to provide users with an overview of important information. In the context of expense management, a dashboard aggregates various data points (such as total expenses, categories, or approval status) and displays them in a clear, user-friendly format, often using charts, graphs, and tables.
Key features of a dashboard in expense management may include:
-
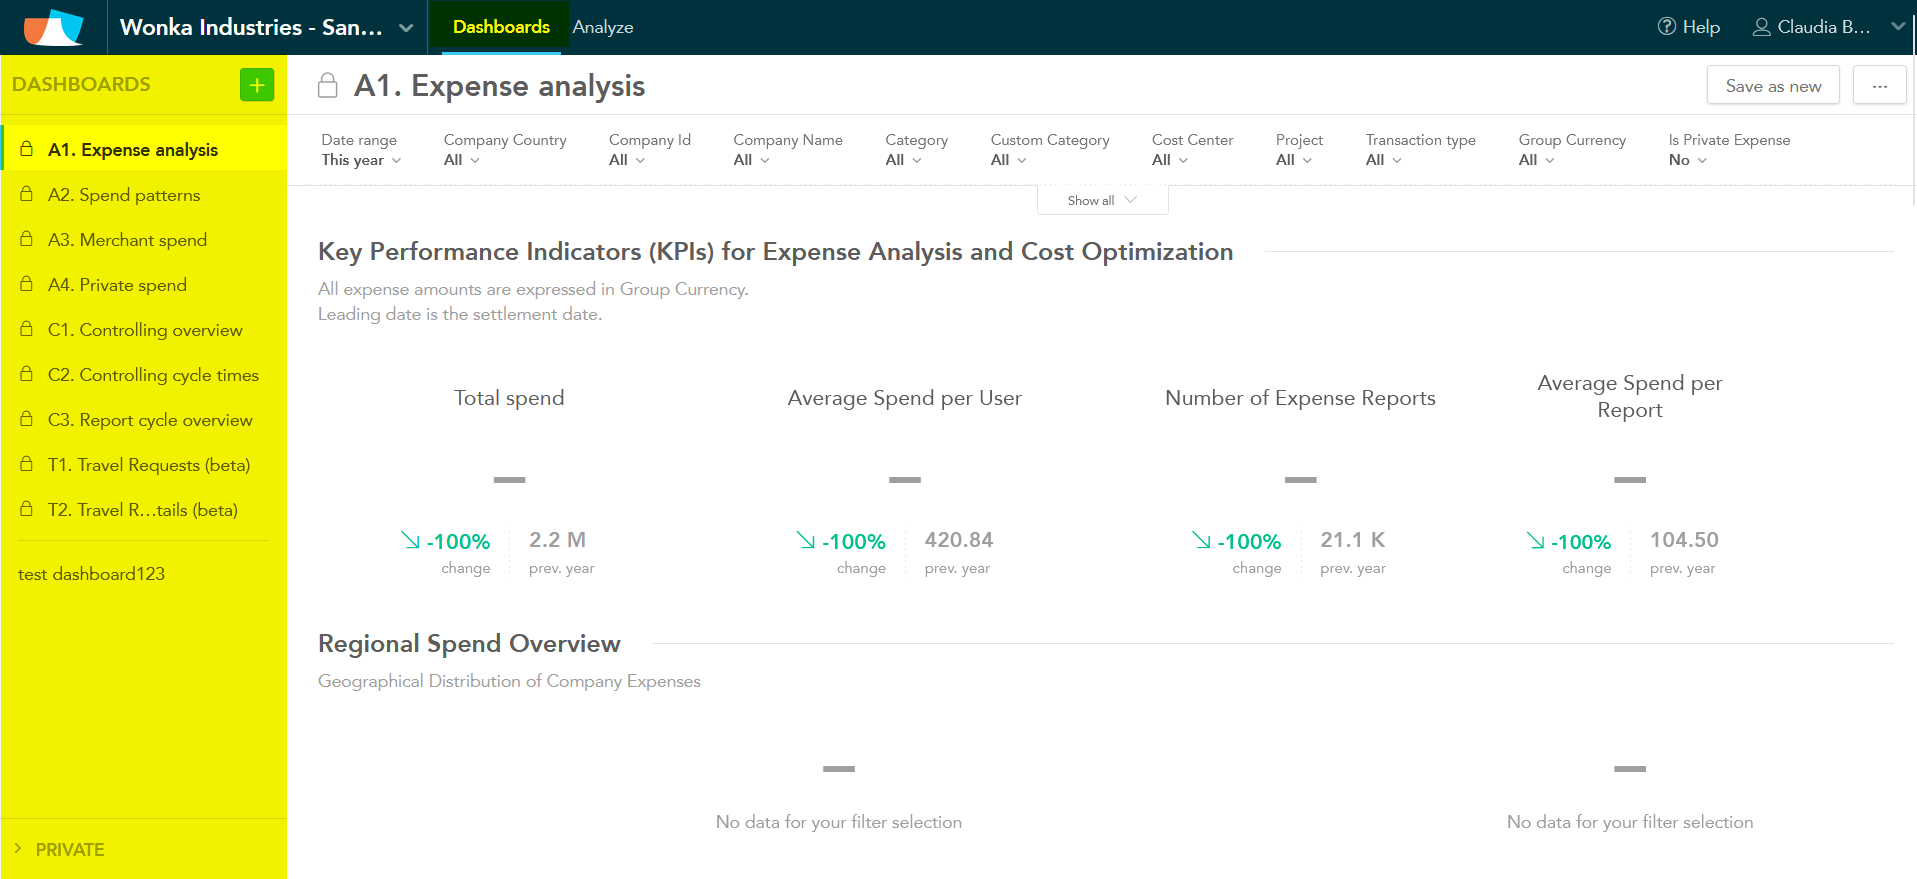
Overview of spending: Displays high-level data such as total expenses, budget vs. actual, and trends over time.
-
Filtering capabilities: Allows users to drill down into specific categories, departments, or time periods to analyze data in more detail.
-
Visual insights: Uses charts, graphs, and tables to make complex data more accessible and easier to understand at a glance.
-
Real-time updates: Provides up-to-date information, so users can track performance and make decisions based on the most current data.
Dashboards are essential tools for monitoring and analyzing business performance, streamlining reporting processes, and enabling faster, data-driven decision-making.