
Setting alerts
In Insights, users can configure alerts based on specific thresholds to monitor key metrics and receive notifications when those thresholds are exceeded. These alerts can be scheduled and managed directly from the dashboard interface. By hovering over the Alert mark associated with a metric (KPI), users can access detailed information about the alert settings and view any triggered alerts.
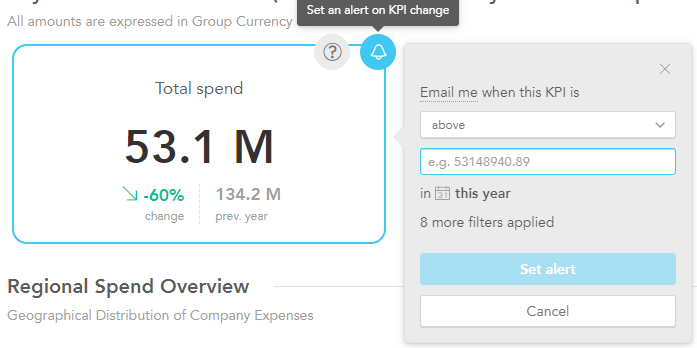
Example of a threshold that can be configure for the Total spend metric.
To schedule alerts and access alert details:
Locate the dashboard that contains the metric (KPI) for which you want to configure an alert.
Hover the mouse cursor over the Alert mark 🔔 associated with the metric. This will display a tooltip or pop-up window with information related to the alert.
In the tooltip, you can configure the specific thresholds and conditions that will trigger the alert. This includes setting the threshold values, defining the comparison operators (e.g., greater than, less than).
Once you have configured the alert settings, save the changes to enable the alert. Any time the threshold will be surpassed an email will be sent to the user that set the alert.
To access alert details and view any triggered alerts, hover the mouse cursor over the Alert mark again. This will display the alert details, such as the current metric value, the configured threshold, and any relevant notifications or actions taken based on the alert status.
Email notifications are typically sent when a metric crosses a threshold boundary in either direction, entering a state that deviates from the normal range. However, if the metric remains consistently above or below the threshold without any subsequent change in direction, it will not generate an email notification.
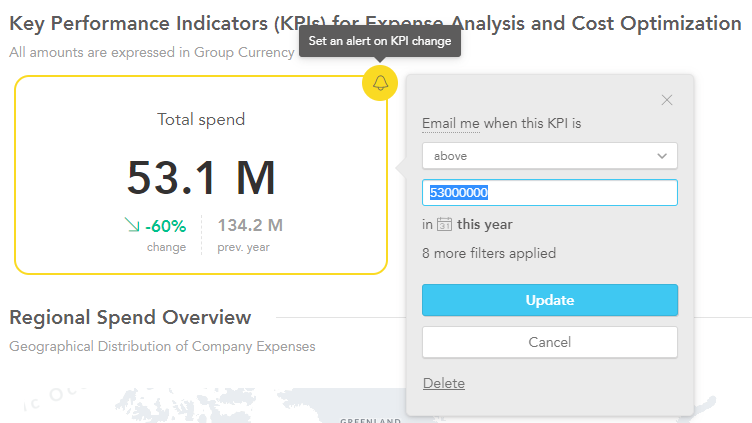
Example of a threshold that is configured for the Total spend metric.
By utilizing this feature, users can proactively monitor key metrics and receive timely notifications when predefined thresholds are exceeded. This helps to ensure prompt attention and action can be taken to address any critical deviations or anomalies.