
Tooltips
Insights provides tooltips for KPIs and insights displayed on dashboards, offering users additional explanatory information about specific items. By hovering the mouse cursor over the "?" mark associated with an item, a tooltip will appear, providing relevant details and context. For charts that can be drilled down or into, the drilled charts are also explained.
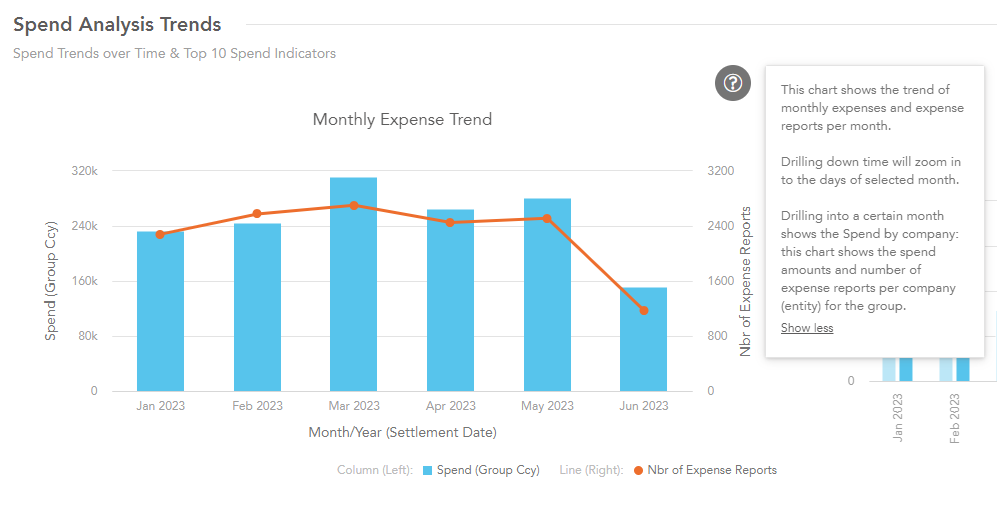
The tooltip of the Monthly Expense Trend showing its description and drill down options.
By utilizing tooltips, users can quickly access contextual information without leaving the dashboard interface.