Filtering: Use of the Date Range filter
This section of the product documentation provides guidance on effectively utilizing the date range filter. It covers various topics related to configuring the filter for specific dashboards, calendar vs. fiscal year considerations, and date range comparisons.
The Date Range filter works on the specific date dimensions that are configured for the insights or KPIs that appear on the dashboard.
Date dimensions
The expense model offers multiple date dimensions to facilitate comprehensive analysis and reporting. These various date dimensions enable users to analyze expenses based on different stages of the process, such as transaction, submission, approval, control, and settlement.
The settlement date and submission date are most used in the pre-made dashboards. Read up on the other available dates here: available date dimensions.
Settlement date
On spend dashboards (A1-A3), giving an insight into spend behavior for reports that are settled, the settlement date is used. This date is derived from the actual settlement of each report.
Note that reporting on item settlement date is available for more detailed item-level analysis.
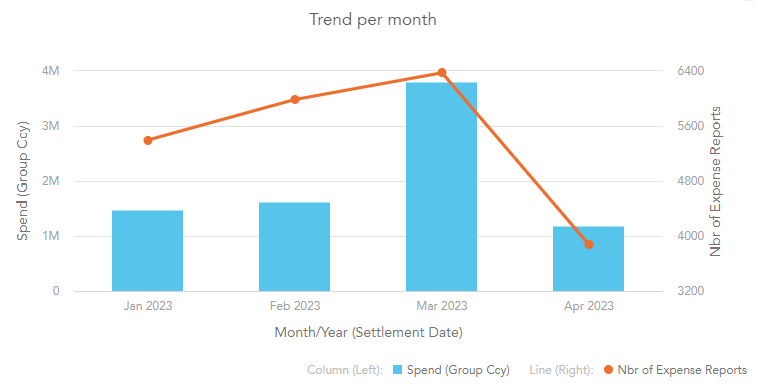
Example: the Trend per month chart on the A1. Spend Analytics dashboard is lead by the settlement date.
Submission date
When generating reports on the approval/control process itself, it is beneficial to have visibility into reports that have been submitted but are not yet settled. In this context, the default configuration includes the "last" submission date of the report.
Please note that, to simplify the reporting process and reduce complexity, previous submission dates and submission dates per item are not included.
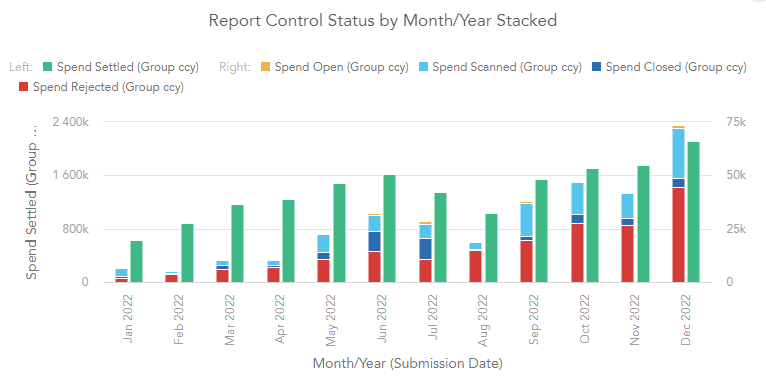
Example: On the dashboard C1. Controlling overview in the section Workflow Performance Overview the insight Report Control Status by Month/Year Stacked is configured to work with Submission date.
Comparing periods
The Date Range filter allows users to define a specific range for analysis, which can be compared to either a previous period or the same period in the previous year, depending on the configuration.
Note that when “All Time” is selected from the Date Range filter the comparison is not shown.
KPIs
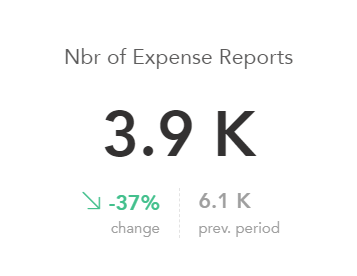
By default, Key Performance Indicators (KPIs) are compared to the previous period. This comparison provides valuable insights into performance changes over time.
Insights
Insights in the platform offer flexibility in configuring date ranges for comparison. Users can choose to compare one or more metrics to:
The previous period: This comparison can be set up to compare quarters (Q3 vs. Q2), weeks (this week vs. last week), or any other relevant time frame.
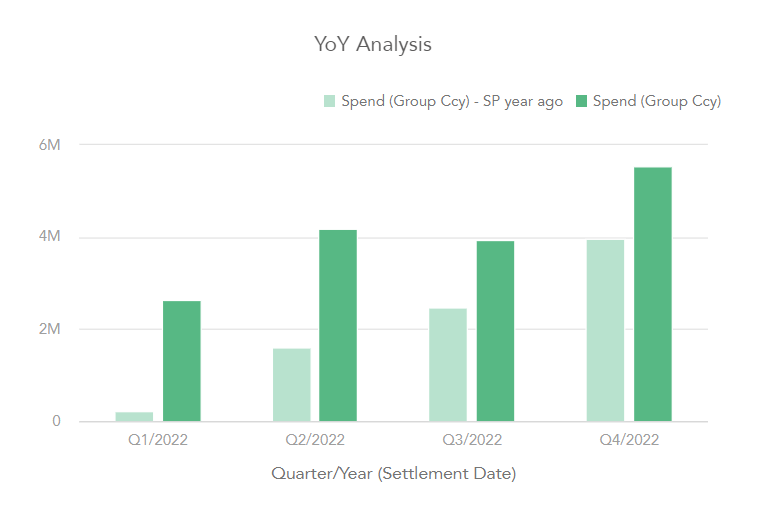
The same period last year: This comparison allows for a year-on-year analysis, comparing the current period to the corresponding period of the previous year (e.g., Q2/2023 vs. Q2/2022).
For example, consider the dashboard A1. Spend Analytics within the Spend Analysis Trends section. The Year on Year Analysis insight displays the quarterly spend of the current year (in Group currency) compared to the corresponding quarter of the previous year (SP year ago) in Group currency.